Enterprise Healthcare UX Research | UHC M&R | MTAG
Member Touchpoint Optimization Application
UHC's Medicare members were drowning in communications. No one could see why — or stop it. I built the research that changed that.
175M
Annual touchpoints
$22.6M
Revenue protected
6×
Stakeholder reviews/yr
71.8
SUS score
Good usability
Project overview
When someone is navigating healthcare for themselves or a family member, every touchpoint is a moment of high-stakes decision-making — this research mapped and optimized those moments across a member journey serving a largely senior population. UnitedHealthcare's Medicare & Retirement division was sending over 175M member communications annually — but had no centralized way to see where campaigns overlapped, which members were being overloaded, or what the downstream business risk actually was.
I was brought in as lead UX researcher when the Member Touchpoint Advocacy & Governance (MTAG) team needed to understand the problem well enough to build a solution. The stakes were clear: unchecked communication overload was threatening member retention, inflating inbound call volume, and putting $22.6M in revenue at risk.
What started as a research engagement became the foundation for an entirely new internal platform — the Member Touchpoint Optimization application — that gave MTAG teams visibility and control they'd never had before. Its headline outcomes — a reported $22.6M in protected revenue and a 6× jump in stakeholder optimization reviews (2 → 12+ a year) — were tracked by the business; my research scoped the problem and built the foundation behind them.
Role: Lead UX Researcher
Methods: User Interviews, Observation, Usability Testing, SUS Survey
Stakeholders: MTAG, Product, Engineering, Senior Leadership
Impact: Retention, Campaign Performance, Operational Efficiency
My contributions
I led this project as the sole researcher, which meant every methodological decision was mine to make — and defend.
My first call was to start with direct observation rather than surveys. The MTAG workflow was too complex and too manual to understand from self-report alone; I needed to see it running in real conditions. That choice surfaced the bottlenecks that shaped everything that followed — specifically, that analysts were spending the majority of their time assembling data before any actual analysis could begin.
From there, I led the full research arc: structured user interviews to map pain points and workflows, close collaboration with design on prototyping, moderated usability testing to surface friction, and a SUS survey to validate experience quality quantitatively. I synthesized findings into journey maps and stakeholder storyboards, and presented recommendations directly to product managers, engineers, and VP-level leadership.
Throughout, I used AI tools deliberately — to accelerate planning, summarize testing sessions, and cluster feedback — so I could spend more time on the interpretive work that actually required a researcher.
Why this matters
175M
member touchpoints in 2022
Without a centralized way to understand touchpoint volume and campaign overlap, teams struggled to identify which communications contributed to member overload. This created risks for retention, campaign performance, inbound call volume, and overall member experience.
PAIN POINT
Fragmented touchpoint data and limited visibility into campaign overlap forced slow, manual investigation to understand member communication.
OPPORTUNITY
Centralize touchpoint and campaign data into a single view so teams can quickly identify and reduce communication overload.
BUSINESS RISK
Unchecked communication overload threatened member retention, campaign performance, and inbound call volume.
Research approach with AI-enhanced activities
Understanding the MTAG workflow
A journey map from the user interviews, tracing how the MTAG team turned touchpoint data into recommended actions — and why that cycle was so costly to run.
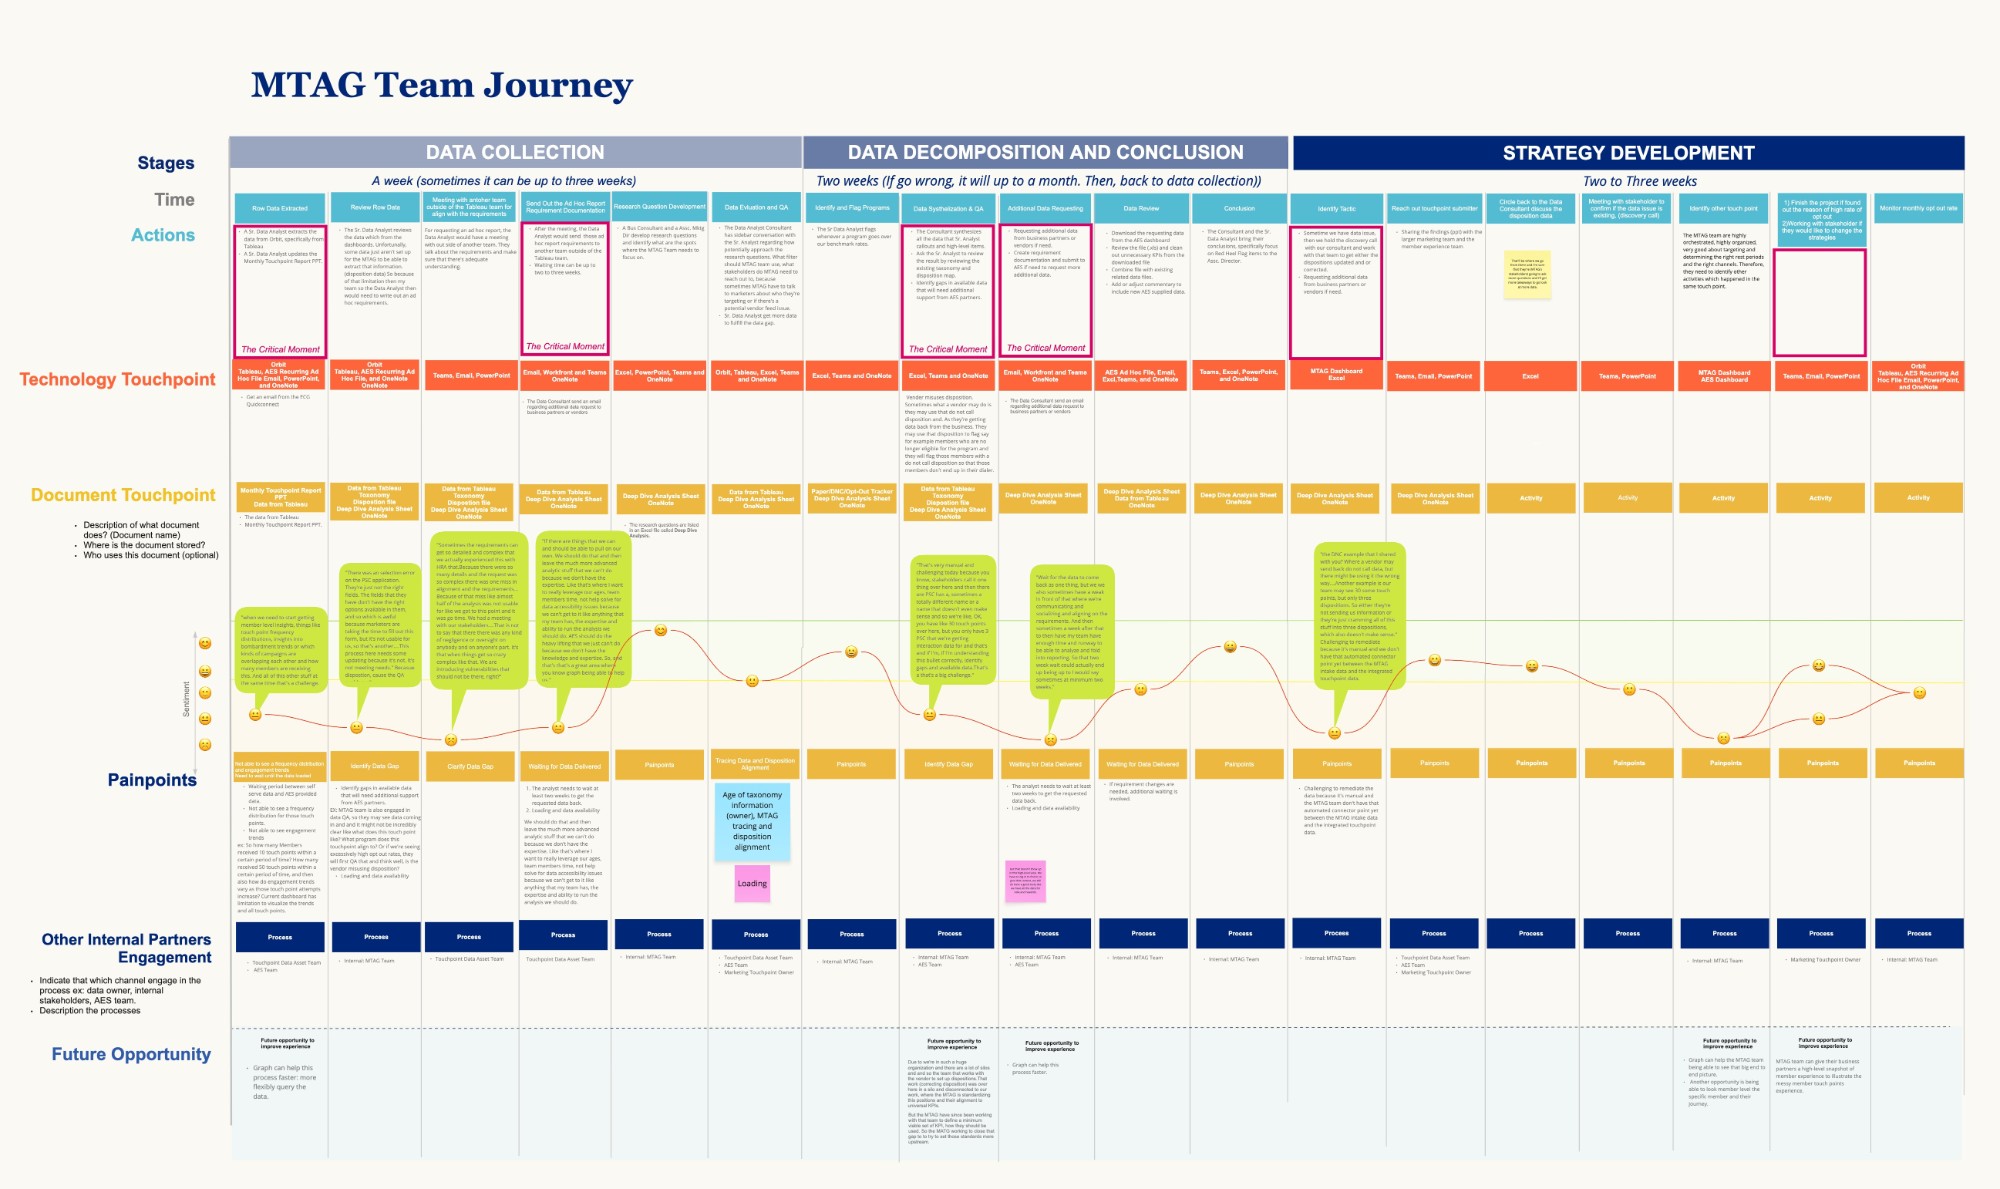
Sequential and manual
Every review ran the full gather, validate, analyze, and recommend sequence by hand — with no way to shortcut or parallelize the steps.
Front-loaded on data prep
Most of each cycle went to assembling and reconciling data before any analysis could begin.
Effort grew with volume
Because the cycle repeated end to end for every campaign, rising touchpoint volume meant linearly rising effort.
What we learned
Users lacked a single source of truth for member touchpoint data.
Communication overload was difficult to detect before campaign launch.
Manual investigation significantly slowed decision-making.
Teams needed member-level context to assess touchpoint relevance.
"I know the data is available. I just need a quicker turnaround to get the data I need."
Hunter Illsley
Business Data Analyst, Member Touchpoint Advocacy & Governance (MTAG)
Visualizing the human impact
Research findings are only as powerful as the decisions they unlock. To move stakeholders from data to action, I translated the research into a narrative video — introducing two personas that made the problem human and immediate.
Judith is a retired teacher and UHC Medicare member managing multiple chronic conditions. She's struggling with technology, and the volume of outbound communications from UHC has left her confused, overwhelmed, and increasingly disengaged.
Janet is the MTAG analyst responsible for protecting members like Judith. She has the will to help — but without a centralized view of touchpoint data, she can't see the problem clearly enough to act on it.
Stakeholder narrative video — Judith & Janet: Member Touchpoint Optimization
Why this artifact mattered
The video walked senior leadership through both perspectives, making visible what the data alone couldn't: that communication overload wasn't just an operational inefficiency — it was affecting real members' lives and their trust in UHC.
• Turned touchpoint data into a human story leadership could see and feel
• Drew a direct line from Janet's frustration to the Member Touchpoint Optimization platform as the solution
• Helped secure stakeholder alignment and executive buy-in for the platform investment
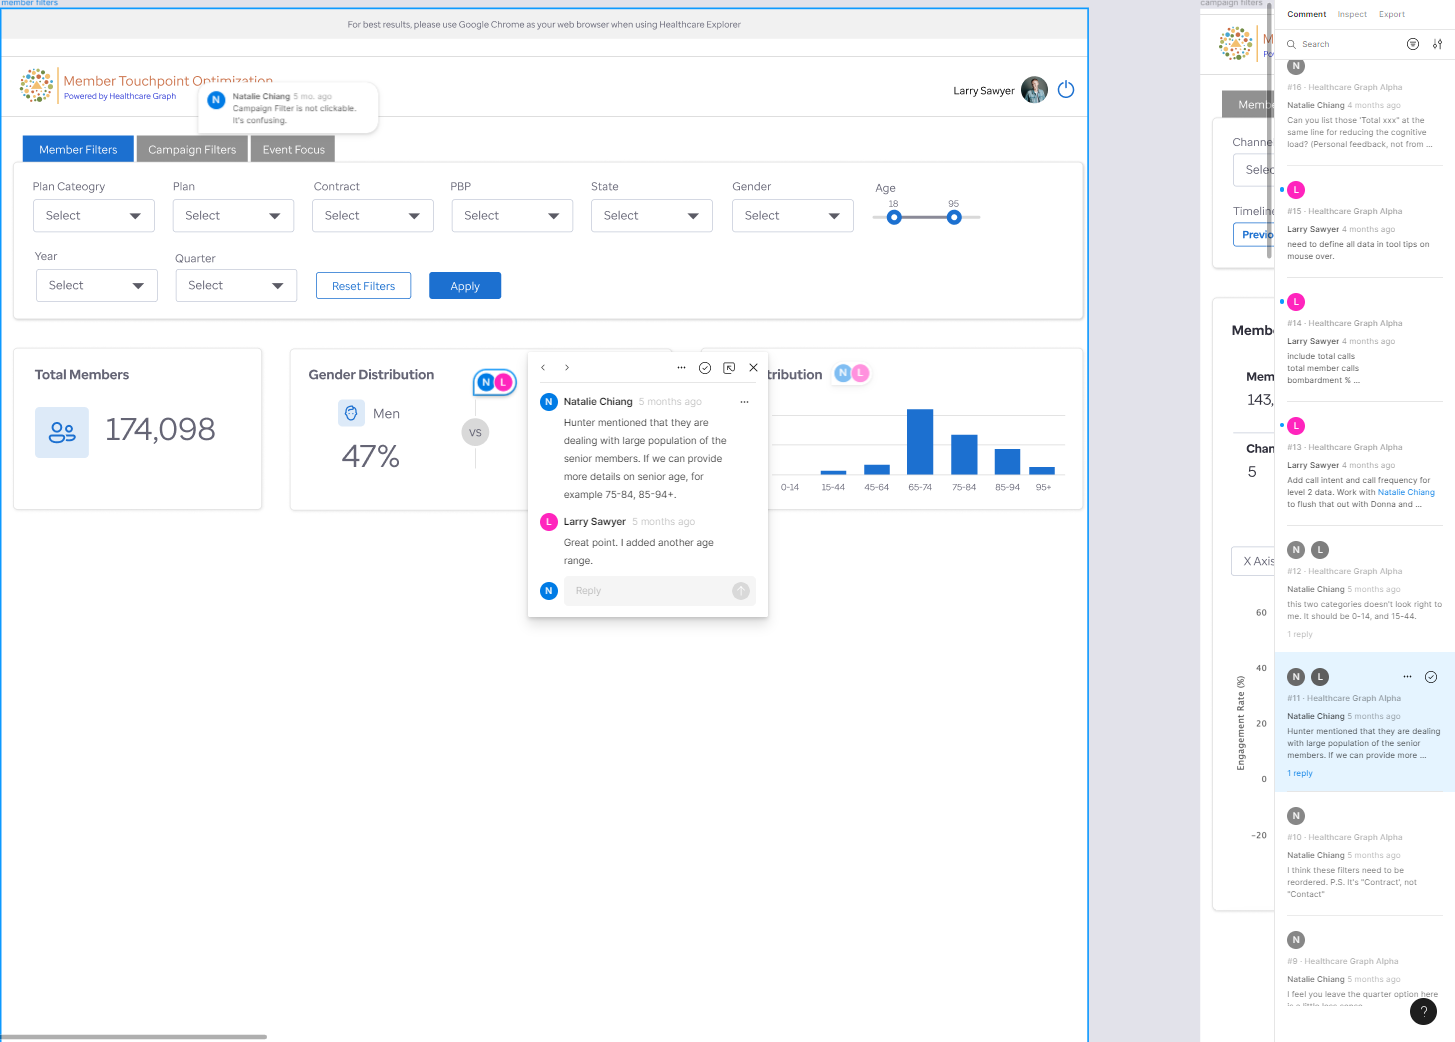
Designing the Member Touchpoint Optimization platform
Working closely with product managers, engineers, and senior designers, I translated research insights into actionable design recommendations that informed the development of the Member Touchpoint Optimization platform.
Member filters
Help users narrow the analysis by member characteristics and population segments.
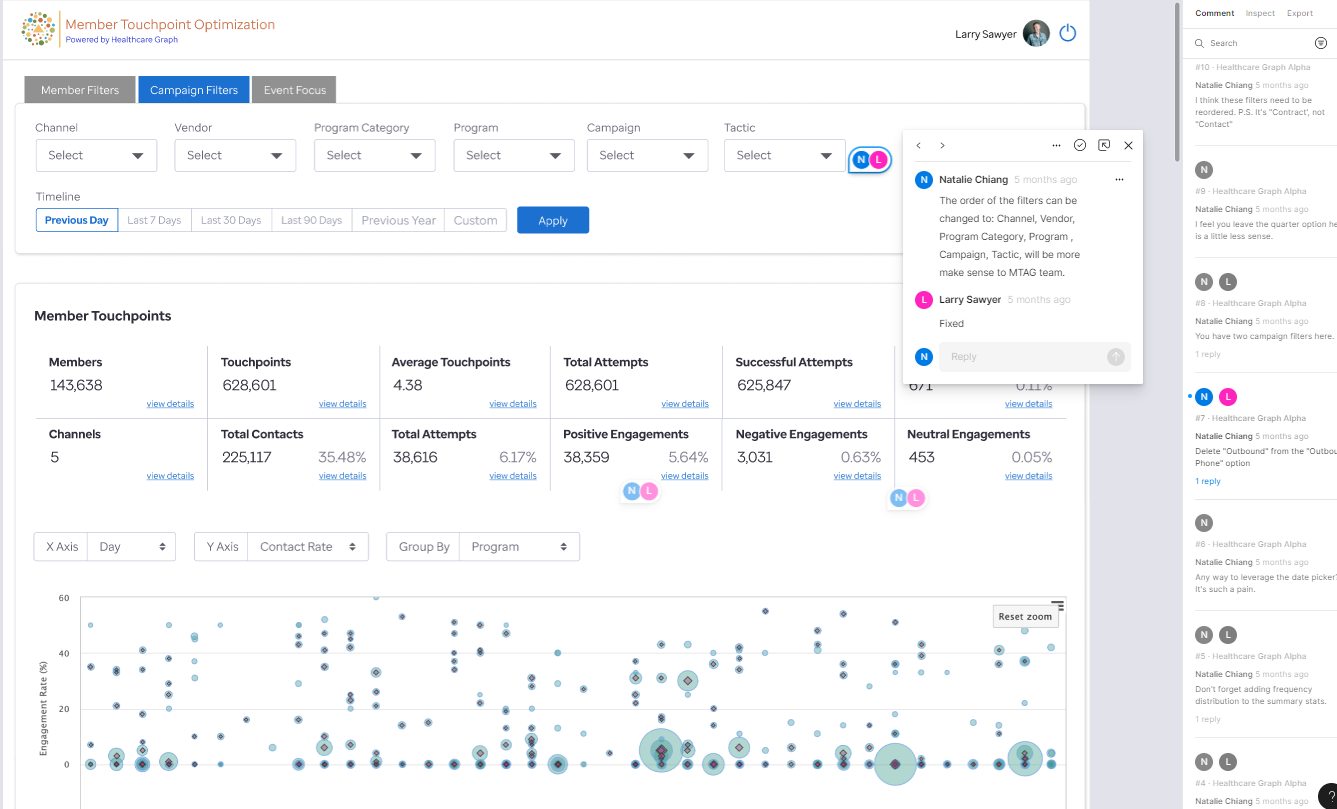
Campaign filters
Allow teams to isolate campaigns, vendors, channels, and program categories.
Touchpoint visualization
Surface communication volume patterns across time and member groups.
Risk identification
Help teams identify bombardment risks before they affect member experience.
Testing and iteration
MVP usability testing
Evaluated whether users could complete core analysis tasks.
Research findings
Identified friction points, unclear labels, and workflow gaps.
Design recommendations
Shared actionable recommendations with design and engineering teams to improve product usability.
SUS survey
Quantitative usability feedback used to validate experience quality.
Research validation
Quantitative results
71.8
Grade B
Good usability rating
50th–85th percentile ranking
0–100 SUS scale
Qualitative feedback
User friendly
Empowering
Sufficient
Game-changing tool
User interviews and usability testing indicated that the platform helped users feel more confident and efficient when analyzing member touchpoint data.
This is a game-changer! Now, I don't need to wait for multiple weeks just to get a dataset from the other team.
Hunter Illsley
Business Data Analyst (MTAG)
The Member Touchpoint Optimization is transformational for MTAG. We now have scalable insights to understand exactly when and where the largest points of touchpoint abrasion are occurring.
Donna Arriaga
Director, Marketing M&R Product
Outcomes & business impact
$22.6M
Revenue loss avoidance
↓ Calls
Reduced inbound call volume
25%
Time efficiency
6×
Stakeholder reviews/yr
✓
Protected critical campaigns
71.8
SUS score
Reflection
What worked
Mixed-method research, strong stakeholder engagement, and close agile collaboration helped connect user pain points to product priorities.
What I learned
Enterprise UX research requires balancing user needs, operational constraints, technical feasibility, and measurable business outcomes.
What I would improve
I would integrate behavioral analytics earlier and track longitudinal adoption data after launch.
More research
Each project tells a different part of the story.
Claim Audit Platform
$20M annual savings · 91.4 SUS
Mapped an eight-plus-system audit workflow into a consolidated redesign.
View case study → B2B · End Users: MA State ResidentsMassachusetts Health Connector Heuristic Evaluation
134 violations · 350K+ residents
A four-person expert review of enrollment workflows, turned into a state-level roadmap.
View case study → Effectiveness Study · Higher EducationDoes concept mapping earn its place?
Kept pace · r = .65 map-to-grade
A controlled comparison testing whether a note-taking tool helps international students keep pace.
View case study →